Operations Directors: Store Portfolio Platform for Retail
Robotic ImagingApril 14, 2026
Store Operations Director Mobile Portfolio Management Platform
For store operations directors overseeing hundreds of retail locations, equipment failures don't just create maintenance tickets — they disrupt sales, damage customer experience, and erode NPS scores you're accountable for. Yet most operations leaders lack mobile visibility into how equipment condition across their portfolio correlates with store performance metrics. Robotic Imaging's mobile portfolio management platform integrates equipment status with store operational intelligence, giving operations directors real-time oversight from any smartphone or tablet — whether during travel, regional manager meetings, or store visits.
If you're currently managing portfolio performance accountability through desktop-bound dashboards while your facilities team controls equipment data in a separate CMMS, you're making capital planning and operational decisions with an incomplete picture. That gap isn't a systems problem — it's a competitive disadvantage.
A store operations director mobile portfolio management platform provides operations-focused portfolio dashboards integrating store performance metrics with equipment status, equipment-operations correlation analysis identifying relationships between equipment age and sales performance, store benchmarking comparing top and bottom performers, real-time equipment failure alerts with operational consequence visibility, and QR code field intelligence during store inspections — all accessible from smartphones and tablets.
> Ready to see your portfolio differently? Request an Operations Director Platform Demo — customized for multi-location retail oversight.
Why Multi-Location Store Operations Visibility Requires a Different Tool
The tools that work for facilities managers don't work for operations directors — and the gap is structural, not cosmetic.
Platforms like ServiceChannel, Limble CMMS, and UpKeep were built to serve maintenance teams: technicians filing work orders, facilities coordinators tracking contractor activity, maintenance managers scheduling preventive service. Their mobile apps reflect that design intent. A technician scanning a QR code to log a work order is a very different workflow than a Regional VP reviewing how equipment age across 80 stores correlates with Q3 same-store sales decline.
That distinction matters because the consequences of using the wrong tool aren't just inconvenient — they're expensive. When equipment intelligence lives in a facilities system that operations leadership can't access on a phone during a regional manager meeting, capital planning discussions default to technical criteria (equipment age, service frequency) rather than operational impact criteria (revenue per location, customer volume, NPS trajectory).
The result: high-volume, high-revenue stores don't always get prioritized for capital investment because the operations director can't quantify — on the fly, in a meeting — how that store's 16-year-old refrigeration equipment is suppressing sales and driving customer complaints.
Robotic Imaging's regional operations platform is built for this gap. It's not a CMMS. It's an operations portfolio management platform where equipment status exists as one layer of a broader store performance view — and where that view is fully accessible on a native iOS or Android app, not a responsive web page downsized for mobile.
Mobile Operations Portfolio Dashboard: Portfolio Intelligence on Any Device
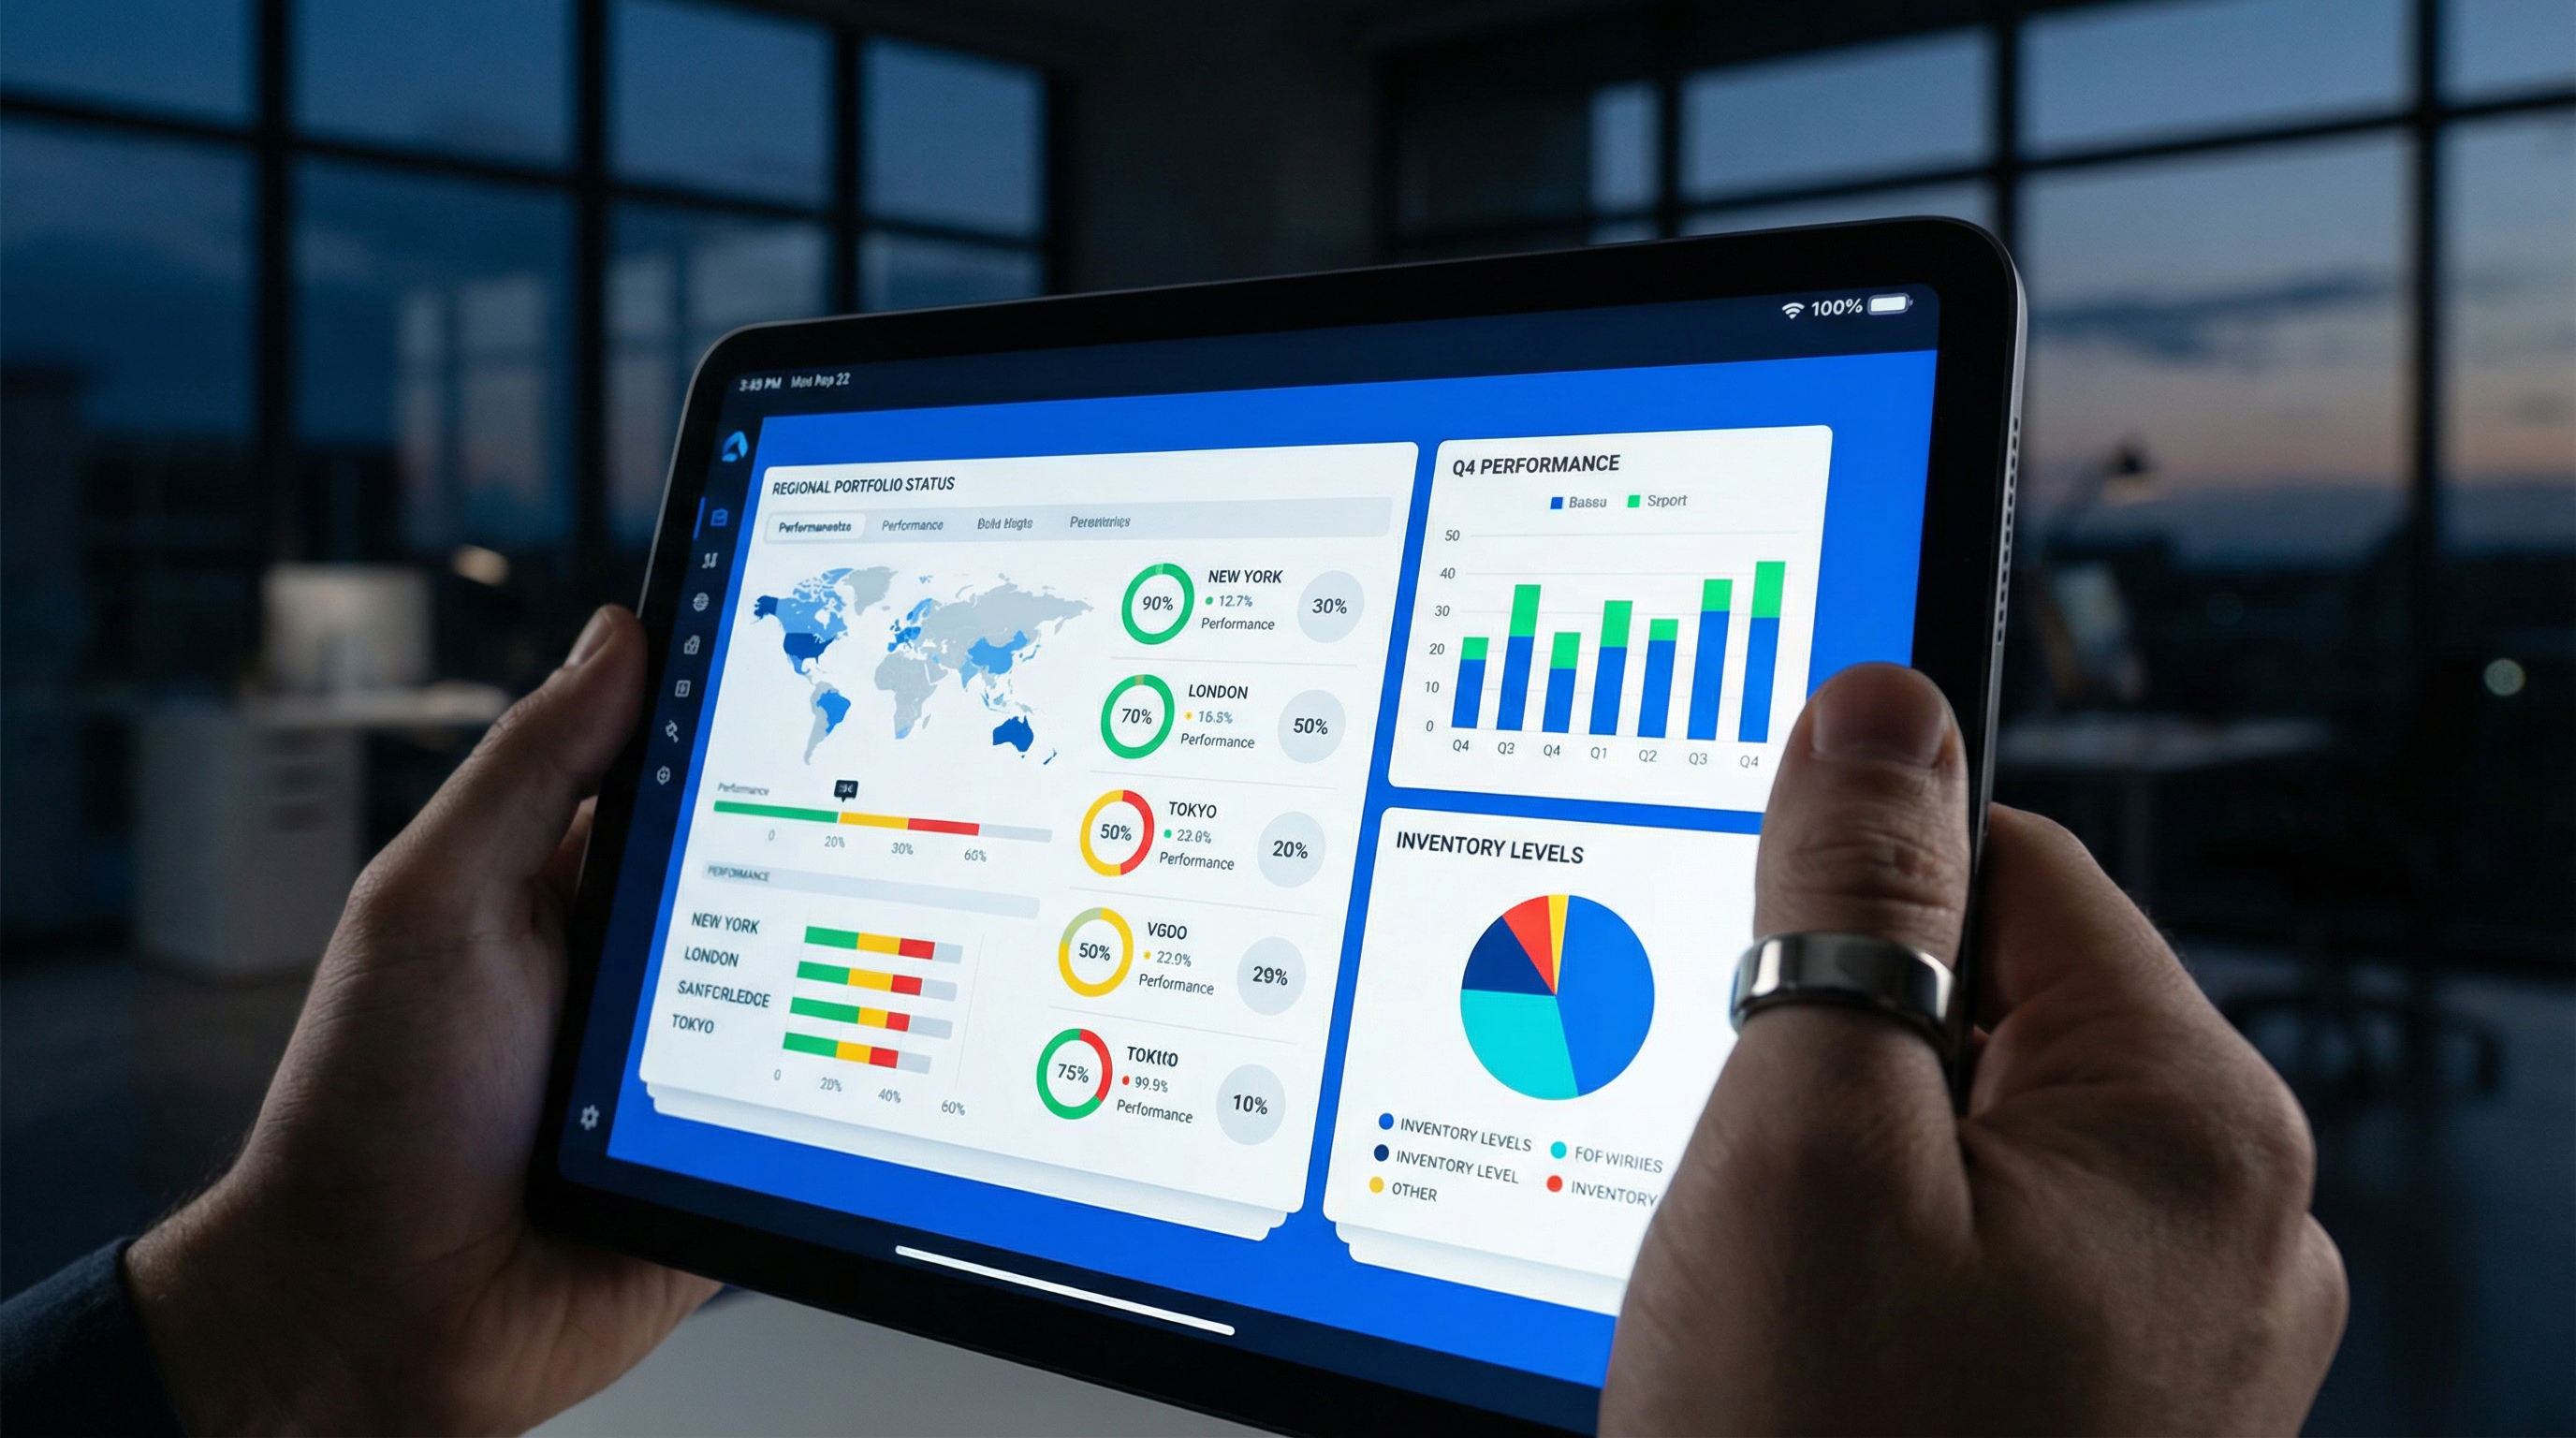
The central capability that separates Robotic Imaging's platform from facilities-first competitors is a mobile-native executive dashboard designed for how operations leadership actually works: in airports, in regional meeting rooms, during store walks, not tethered to an office workstation.
The native iOS and Android apps deliver full portfolio dashboard functionality with <2 second load times and 60fps scrolling — performance specs that matter when you're pulling up a 400-location portfolio view in front of a regional manager team waiting for data. Offline functionality caches 1,000+ equipment units locally, meaning your dashboard remains operational during store visits in areas with poor connectivity.
What the mobile operations portfolio dashboard surfaces:
- Portfolio-level store performance: Same-store sales trends, NPS scores, and operational KPIs aggregated across your entire portfolio, filterable by region, district, and store format
- Equipment status overlay: Equipment health, age, and service history displayed alongside store performance metrics — not in a separate system tab
- Real-time sync: Equipment status and store data update continuously, so the dashboard you review Monday morning reflects weekend activity
- Drill-down navigation: Tap any store in the portfolio view to access location-specific performance data, equipment inventory, and service history without leaving the app
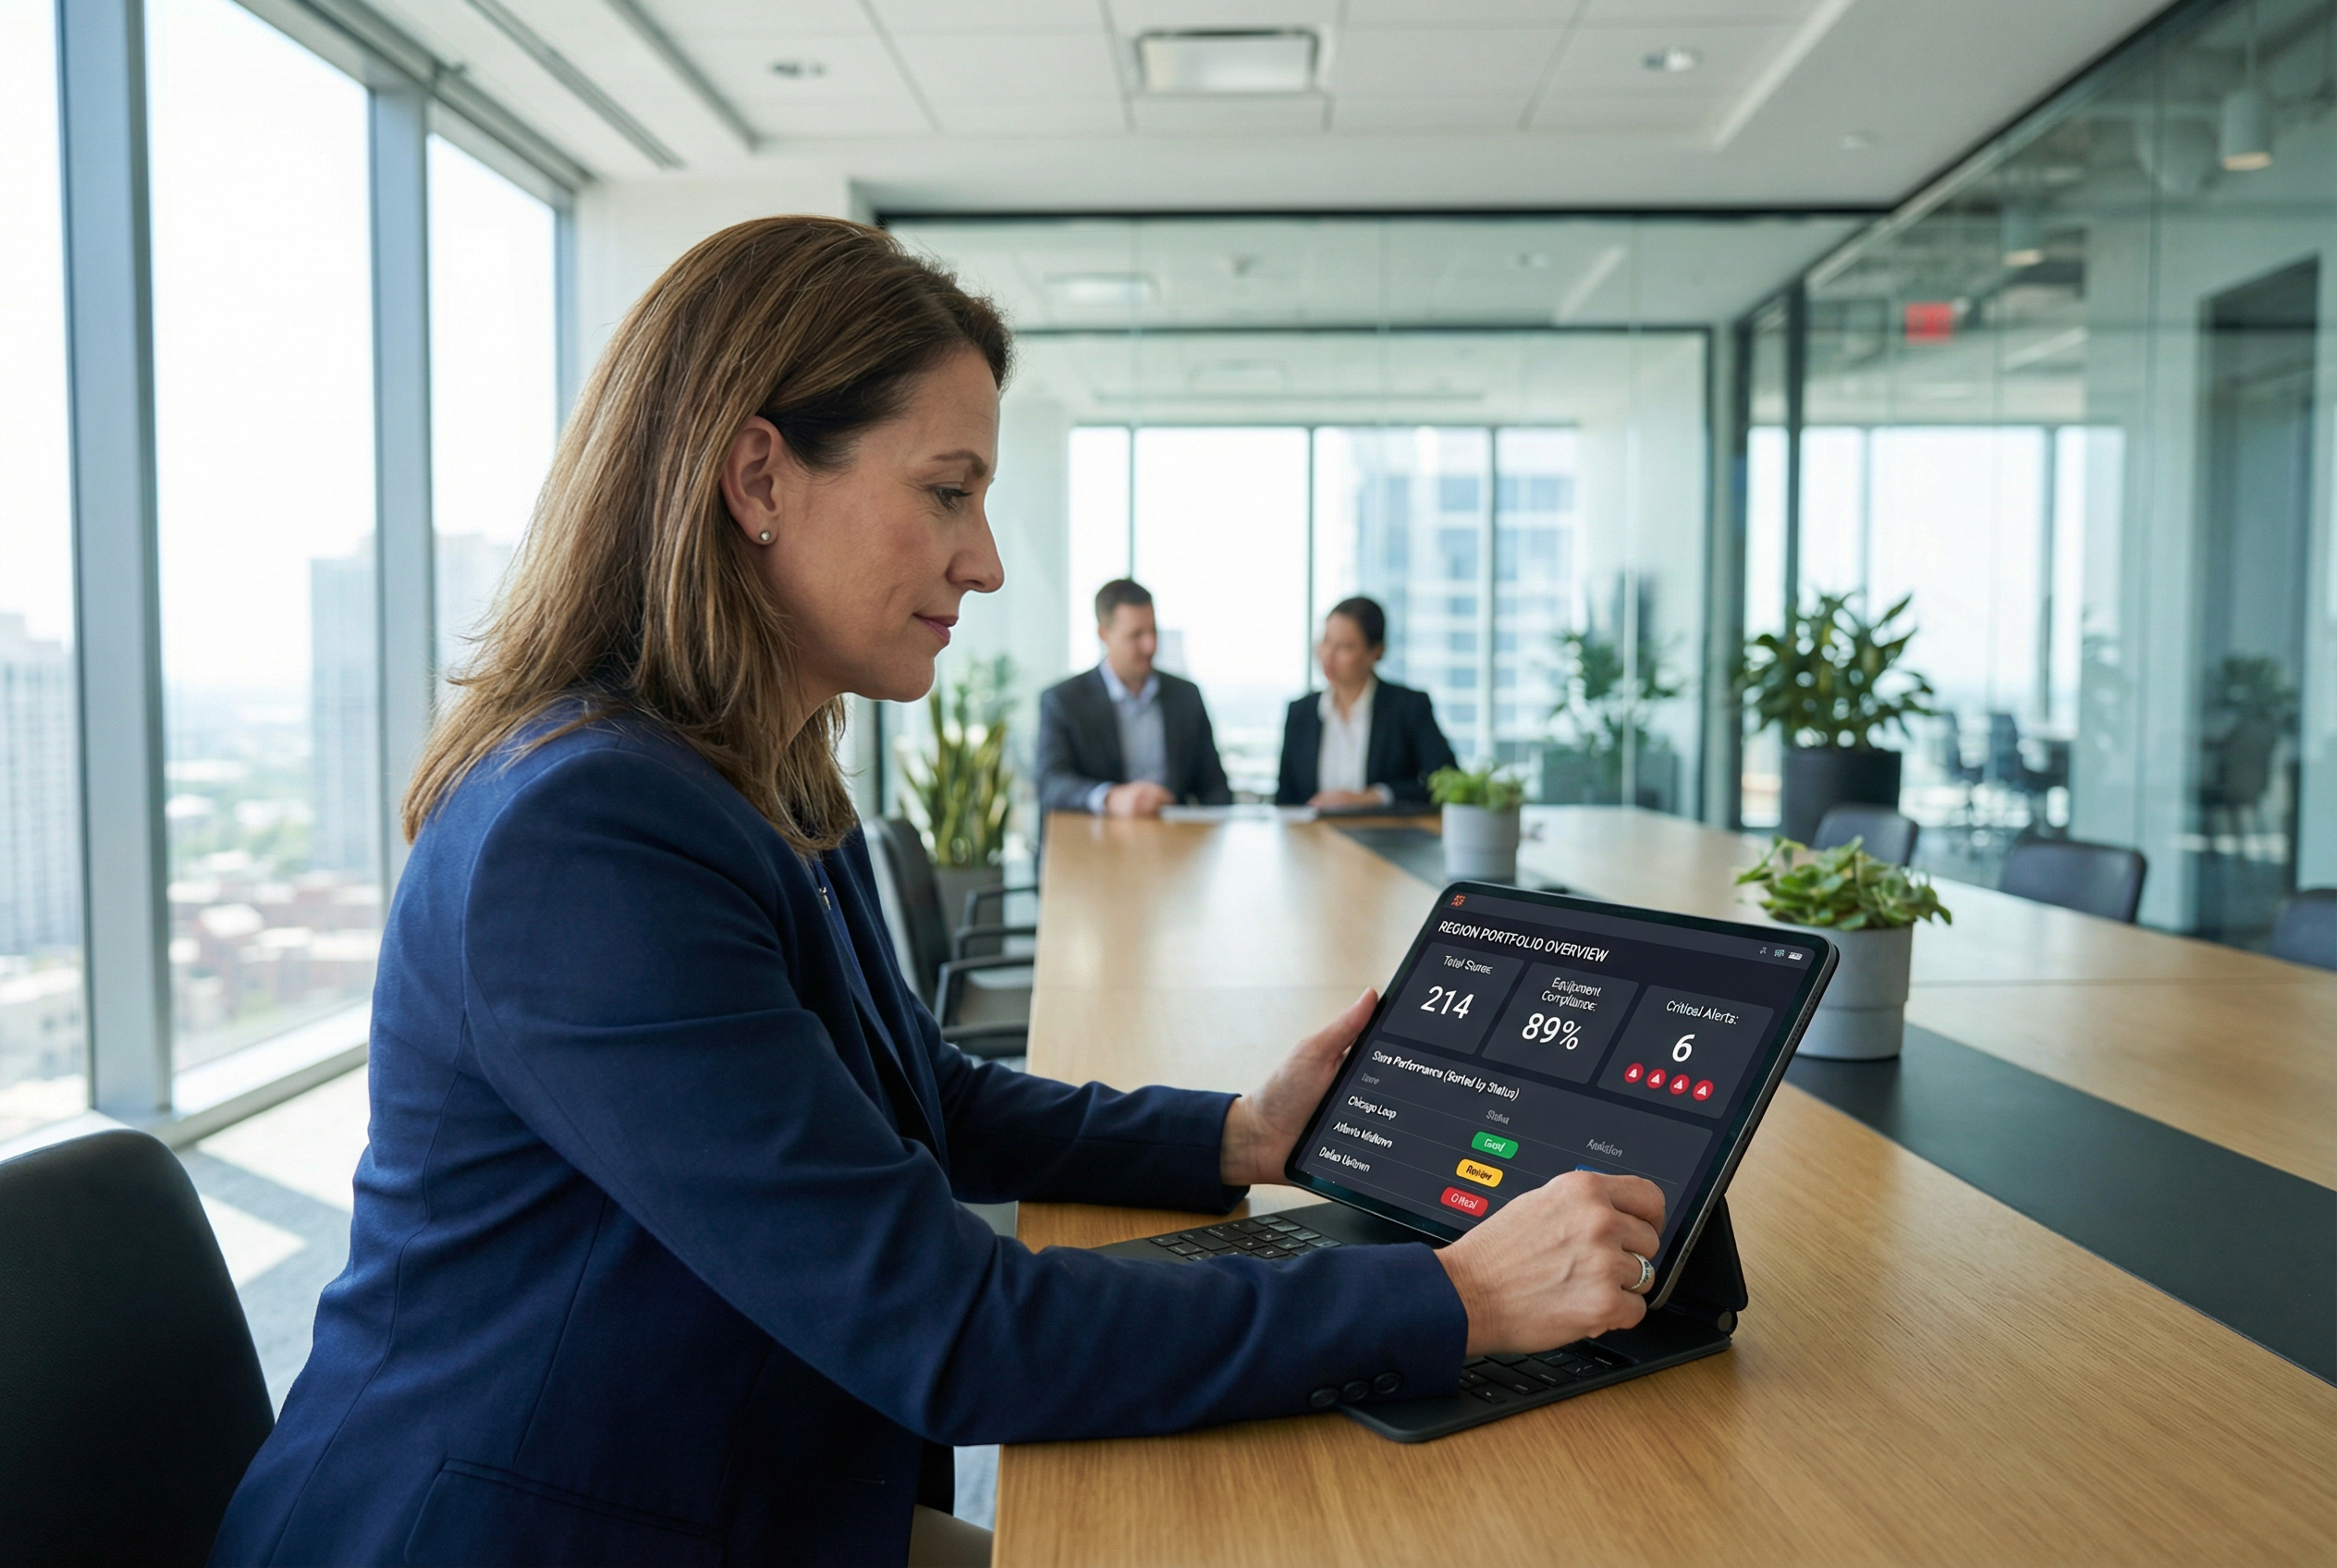
For operations directors managing the multi-store operations management responsibility across dozens of districts, this isn't just a convenience upgrade — it's a structural change in what decisions become possible outside the office. Regional manager meetings can be driven by live portfolio data on a tablet rather than a pre-prepared PowerPoint built from last week's exports.
The distinction from desktop-first competitors is concrete: when a facilities management platform offers a "mobile view," it typically means a responsive web interface with reduced functionality, designed for technicians logging work orders. Robotic Imaging's retail operations portfolio platform builds mobile functionality first — the operations VP experience isn't a scaled-down version of a desktop report.
Equipment-Operations Impact Analysis: The Correlation Your Current System Can't Show
The question every operations director eventually confronts: _Is this store's performance problem an operations issue or an equipment issue?_
Traditional CMMS platforms can tell your facilities team that Store #1147 has aging refrigeration equipment with three service calls in the last 12 months. What they can't tell you — and what Robotic Imaging's platform surfaces — is how that equipment condition pattern correlates with Store #1147's declining grocery sales, rising customer complaint volume, and NPS scores trending 12 points below comparable stores in the same district.
Portfolio analysis from operations data consistently reveals meaningful performance gaps between stores with strong equipment health profiles and stores carrying aging, frequently serviced equipment. The pattern is directionally consistent: stores in the bottom tier by equipment age typically show measurably lower sales performance against comparable locations with newer equipment profiles — differences that portfolio intelligence analysis can quantify and present to capital planning stakeholders.
This is the layer of intelligence operations directors need for cross-functional advocacy but rarely have: not just "this store has old equipment" but "this store's equipment condition is measurably suppressing sales against its peer cohort, and here's the portfolio data to support that claim."
Robotic Imaging's platform enables this analysis by connecting AI-extracted equipment data — captured at 85-90% automated accuracy from smartphone photos — with store performance metrics in a unified portfolio view. The AI extraction speed (30-60x faster than manual documentation) means equipment data is current rather than months stale, making the correlation analysis operationally useful rather than historically interesting.
For the objection that "equipment management is facilities' job, not mine" — this is the precise reframing: Robotic Imaging's platform doesn't ask operations directors to manage equipment. It shows them how equipment condition is affecting the KPIs they already own.
Store Performance Benchmarking: Identify Equipment-Driven Underperformers
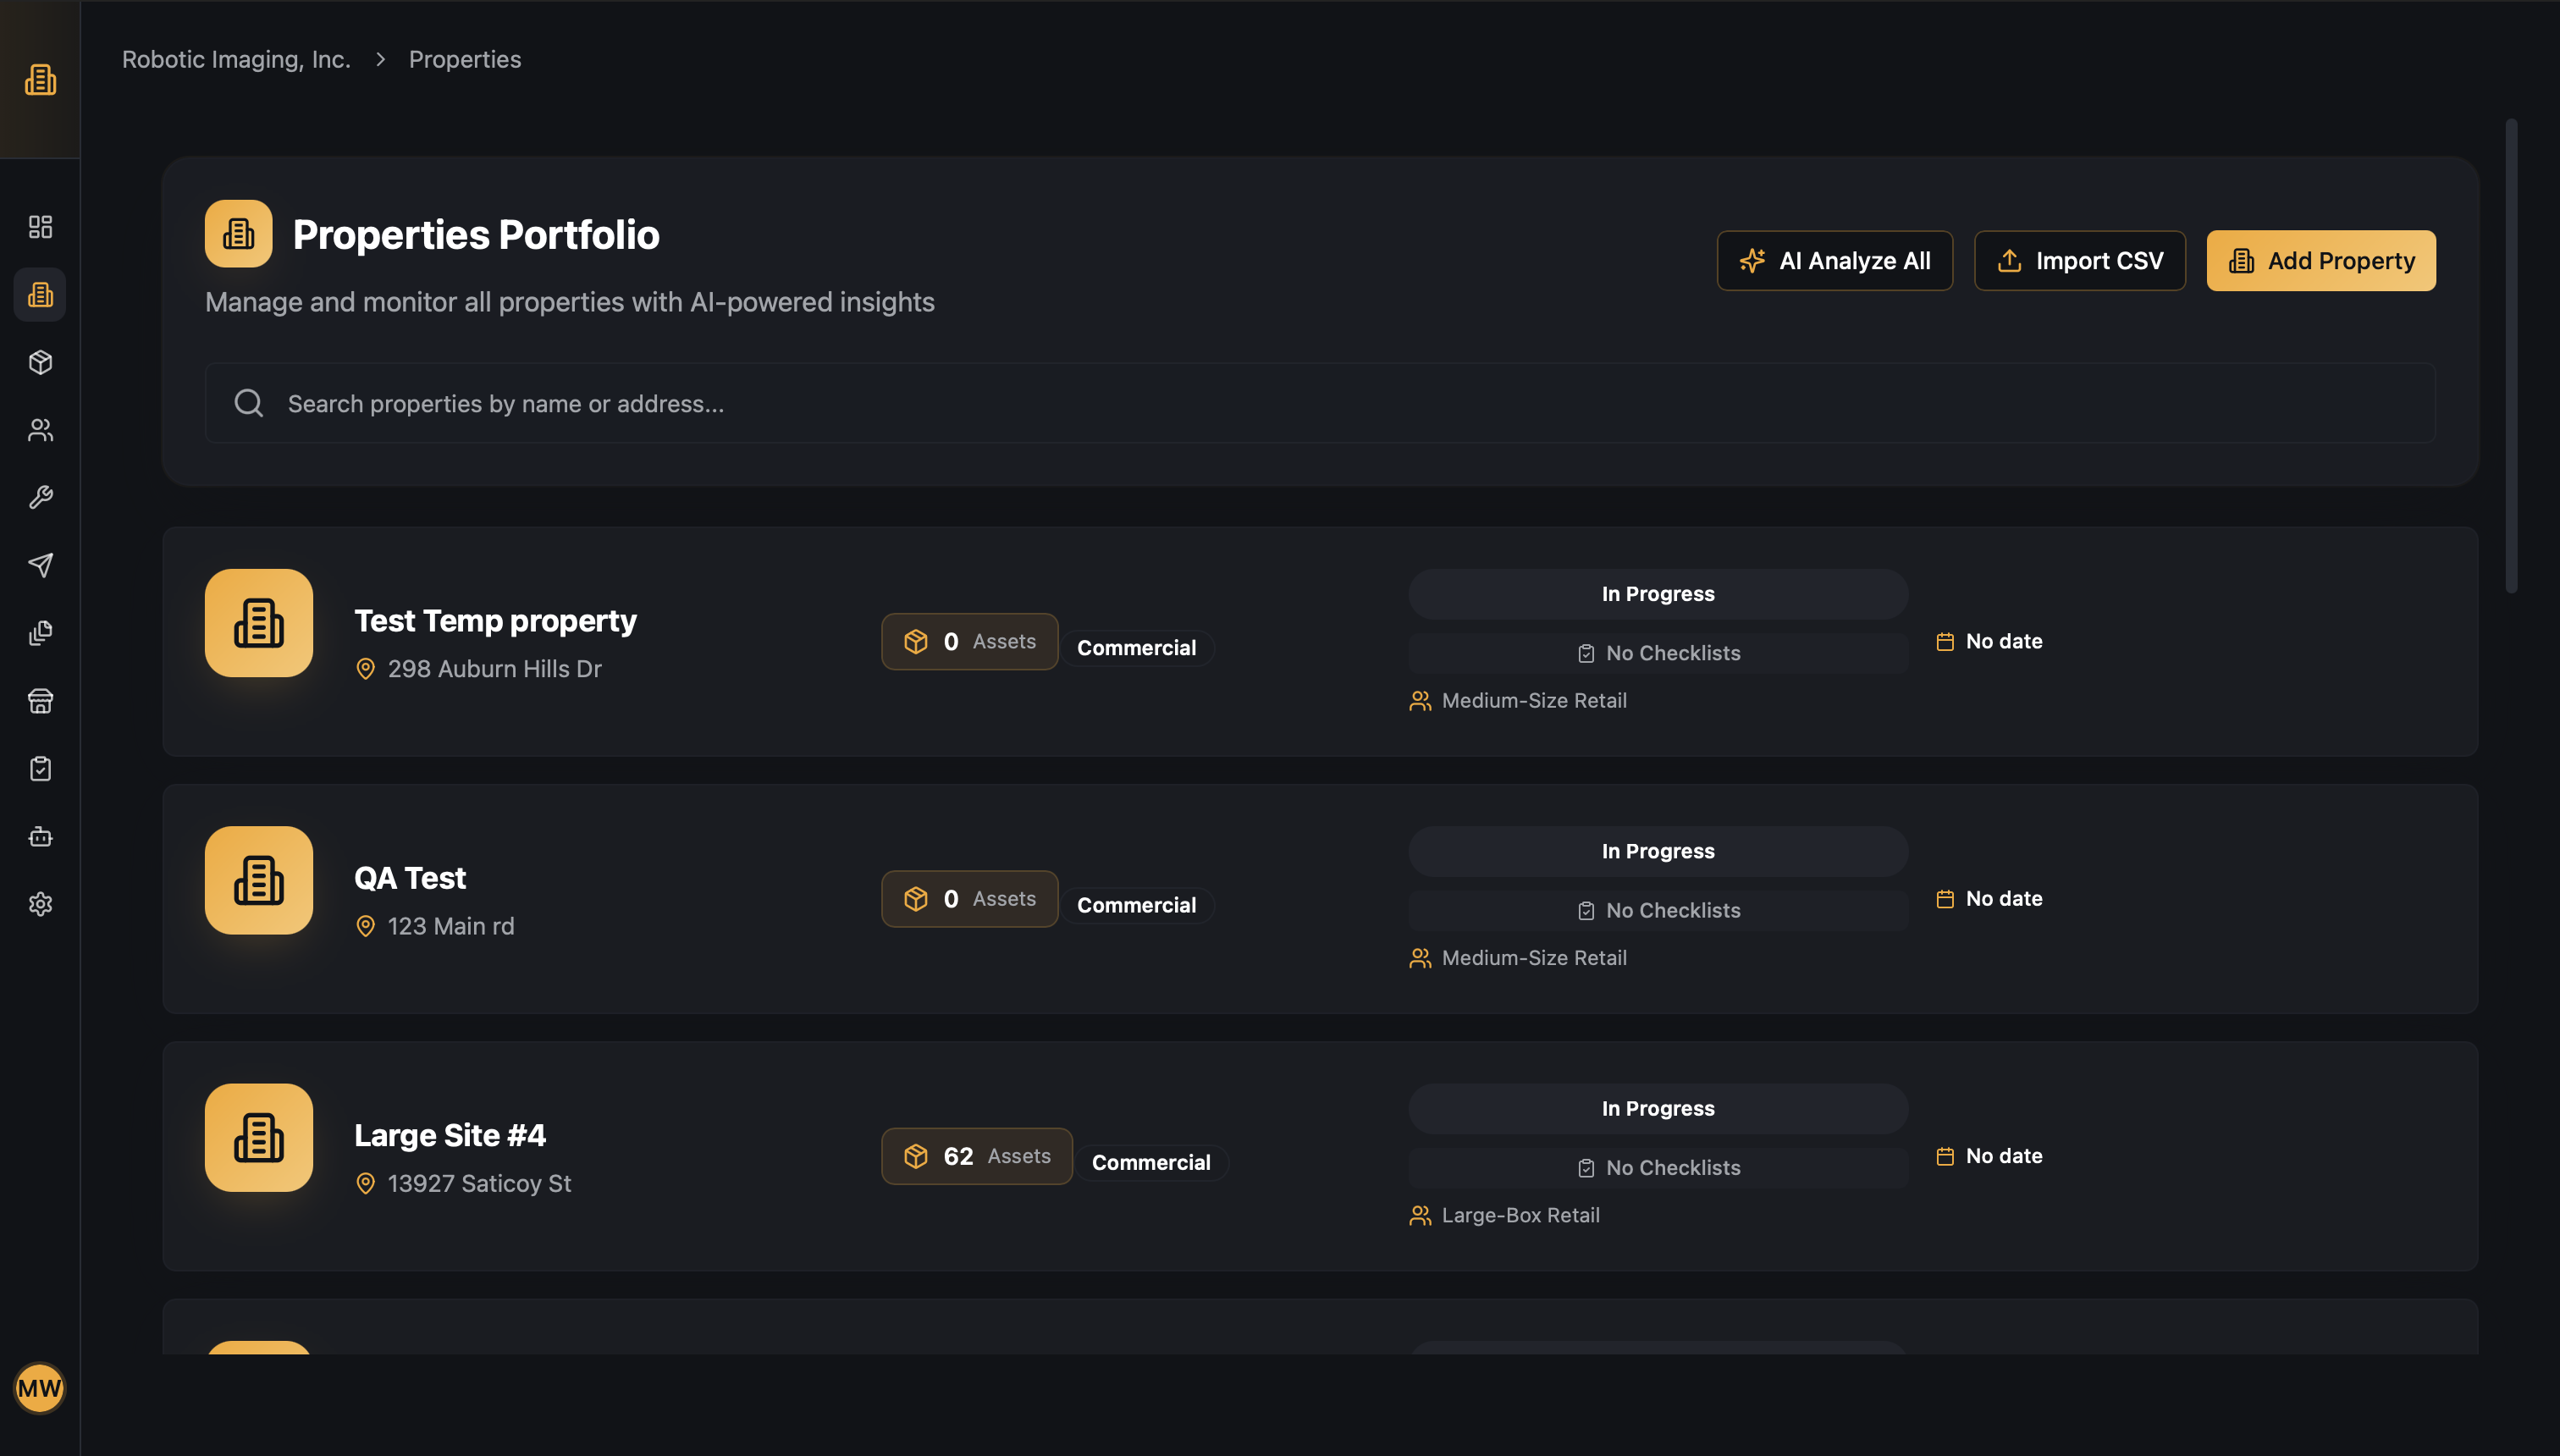
Store benchmarking is a standard operations director capability — ranking locations by sales performance, labor efficiency, customer satisfaction, and shrinkage is baseline multi-site operations management. What's rarely available is the equipment dimension of that benchmarking: how does equipment age and condition profile differ between your top-performing and bottom-performing stores?
Robotic Imaging's store portfolio management software surfaces this benchmarking layer with direct comparison between stores segmented by equipment status. Portfolio intelligence analysis reveals a consistent pattern: stores in the top performance decile by sales tend to carry significantly younger, better-maintained equipment profiles than stores in the bottom performance decile — with the equipment age gap across those cohorts often spanning a decade or more.
Practical benchmarking scenarios the platform enables:
- Segment by equipment age: View all stores with average equipment age above a defined threshold alongside their performance metrics — identify how many underperforming stores also carry aged equipment versus how many are purely operations-driven underperformers
- Compare peer stores: Benchmark Store A against stores with similar format, volume, and market profile — filtering to show only stores with comparable equipment age to isolate operations variables
- Track improvement over time: As capital investment refreshes equipment at specific stores, track whether performance metrics improve relative to the benchmarked peer group — creating before/after evidence for future capital advocacy
This benchmarking capability transforms capital planning preparation. Instead of arguing "Store #1147 needs new equipment because the refrigeration is old," operations directors can present: "The bottom 20 stores by equipment profile are generating 28% lower sales per square foot against format-matched peers with newer equipment — capital prioritized to these locations has a documented performance recovery pattern."
For multi-site operations management, the ability to present this analysis from a tablet during a capital planning session — with live data, not prepared slides — is a meaningful competitive advantage in cross-functional budget discussions.
Equipment Failure Alerts with Operational Consequence Visibility
Reactive equipment response is the operations director's most expensive blind spot. Learning about a refrigeration failure after product loss has already occurred, or discovering that HVAC failure during a summer heat event drove customer complaints and walkouts, represents a gap that most current operations platforms don't address.
Robotic Imaging's platform delivers real-time equipment failure alerts with operational consequence framing designed for operations leadership — not maintenance routing. When critical equipment at a high-volume location shows failure indicators, the alert surfaces not just the equipment status but the operational context: the store's revenue profile, recent NPS trajectory, and the estimated product loss or customer experience impact based on equipment type and store performance data.
The difference between a maintenance alert and an operations alert is the business context. A facilities platform tells a maintenance coordinator "Refrigeration Unit 4 at Store #0892 requires service." Robotic Imaging's platform tells the Regional VP: "Store #0892 — ranked #3 in district by weekly revenue — showing refrigeration failure indicators. This store averaged 2,200 daily customer transactions last quarter. Portfolio analysis shows NPS declines averaging 12 points at comparable locations following major refrigeration events."
That framing enables operations mobile oversight decisions that weren't previously available: escalating urgency for high-revenue locations, pre-positioning customer service response, alerting district management before complaints surface publicly.
The 7-Eleven deployment — spanning 1,000+ store locations — demonstrates this alerting capability at enterprise retail scale. Operations portfolio intelligence functioning across a network of that size requires real-time sync reliability and mobile delivery that works across diverse connectivity environments, which the platform's offline caching and native app architecture directly supports.
Operations-Facilities Capital Planning Collaboration
The capital planning conversation is where operations directors most need mobile portfolio intelligence — and where most current systems fail them most completely.
Traditional capital planning processes give facilities teams the equipment data (age, condition, service cost) and operations teams the performance data (sales, NPS, customer volume). These inputs arrive in separate reports, prepared by different teams, and combined in discussion rather than in a unified analytical layer. The operations director advocating for equipment investment at a high-revenue store is working from intuition and assembled exports — not from integrated portfolio analysis.
Robotic Imaging's operations director mobile platform changes the capital planning dynamic by integrating equipment condition data with store performance metrics in a portable, presentation-ready format. Before a capital planning session, operations directors can build a portfolio view showing stores ranked by the combination of equipment age and revenue impact — the stores where aging equipment is creating the highest operational risk relative to location value.
During the session, that view is accessible live on a tablet: drill into any store, show equipment age by category, overlay sales and NPS performance, compare to district peers. The $600K+ net annual value documented for 100-store portfolio deployments reflects this capital efficiency improvement — equipment investment directed to locations where the operations impact justifies prioritization, rather than allocated on technical criteria alone.
The QR code label infrastructure — priced at $0.01-0.05 per label — enables a complementary capital planning input: operations directors visiting stores can scan equipment during walkthroughs and access complete equipment history, service records, and performance correlations instantly. That field intelligence, gathered during normal store visit cadence, strengthens capital advocacy with location-specific evidence gathered firsthand.
QR Code Store Visit Intelligence: Field Operations at the Equipment Level
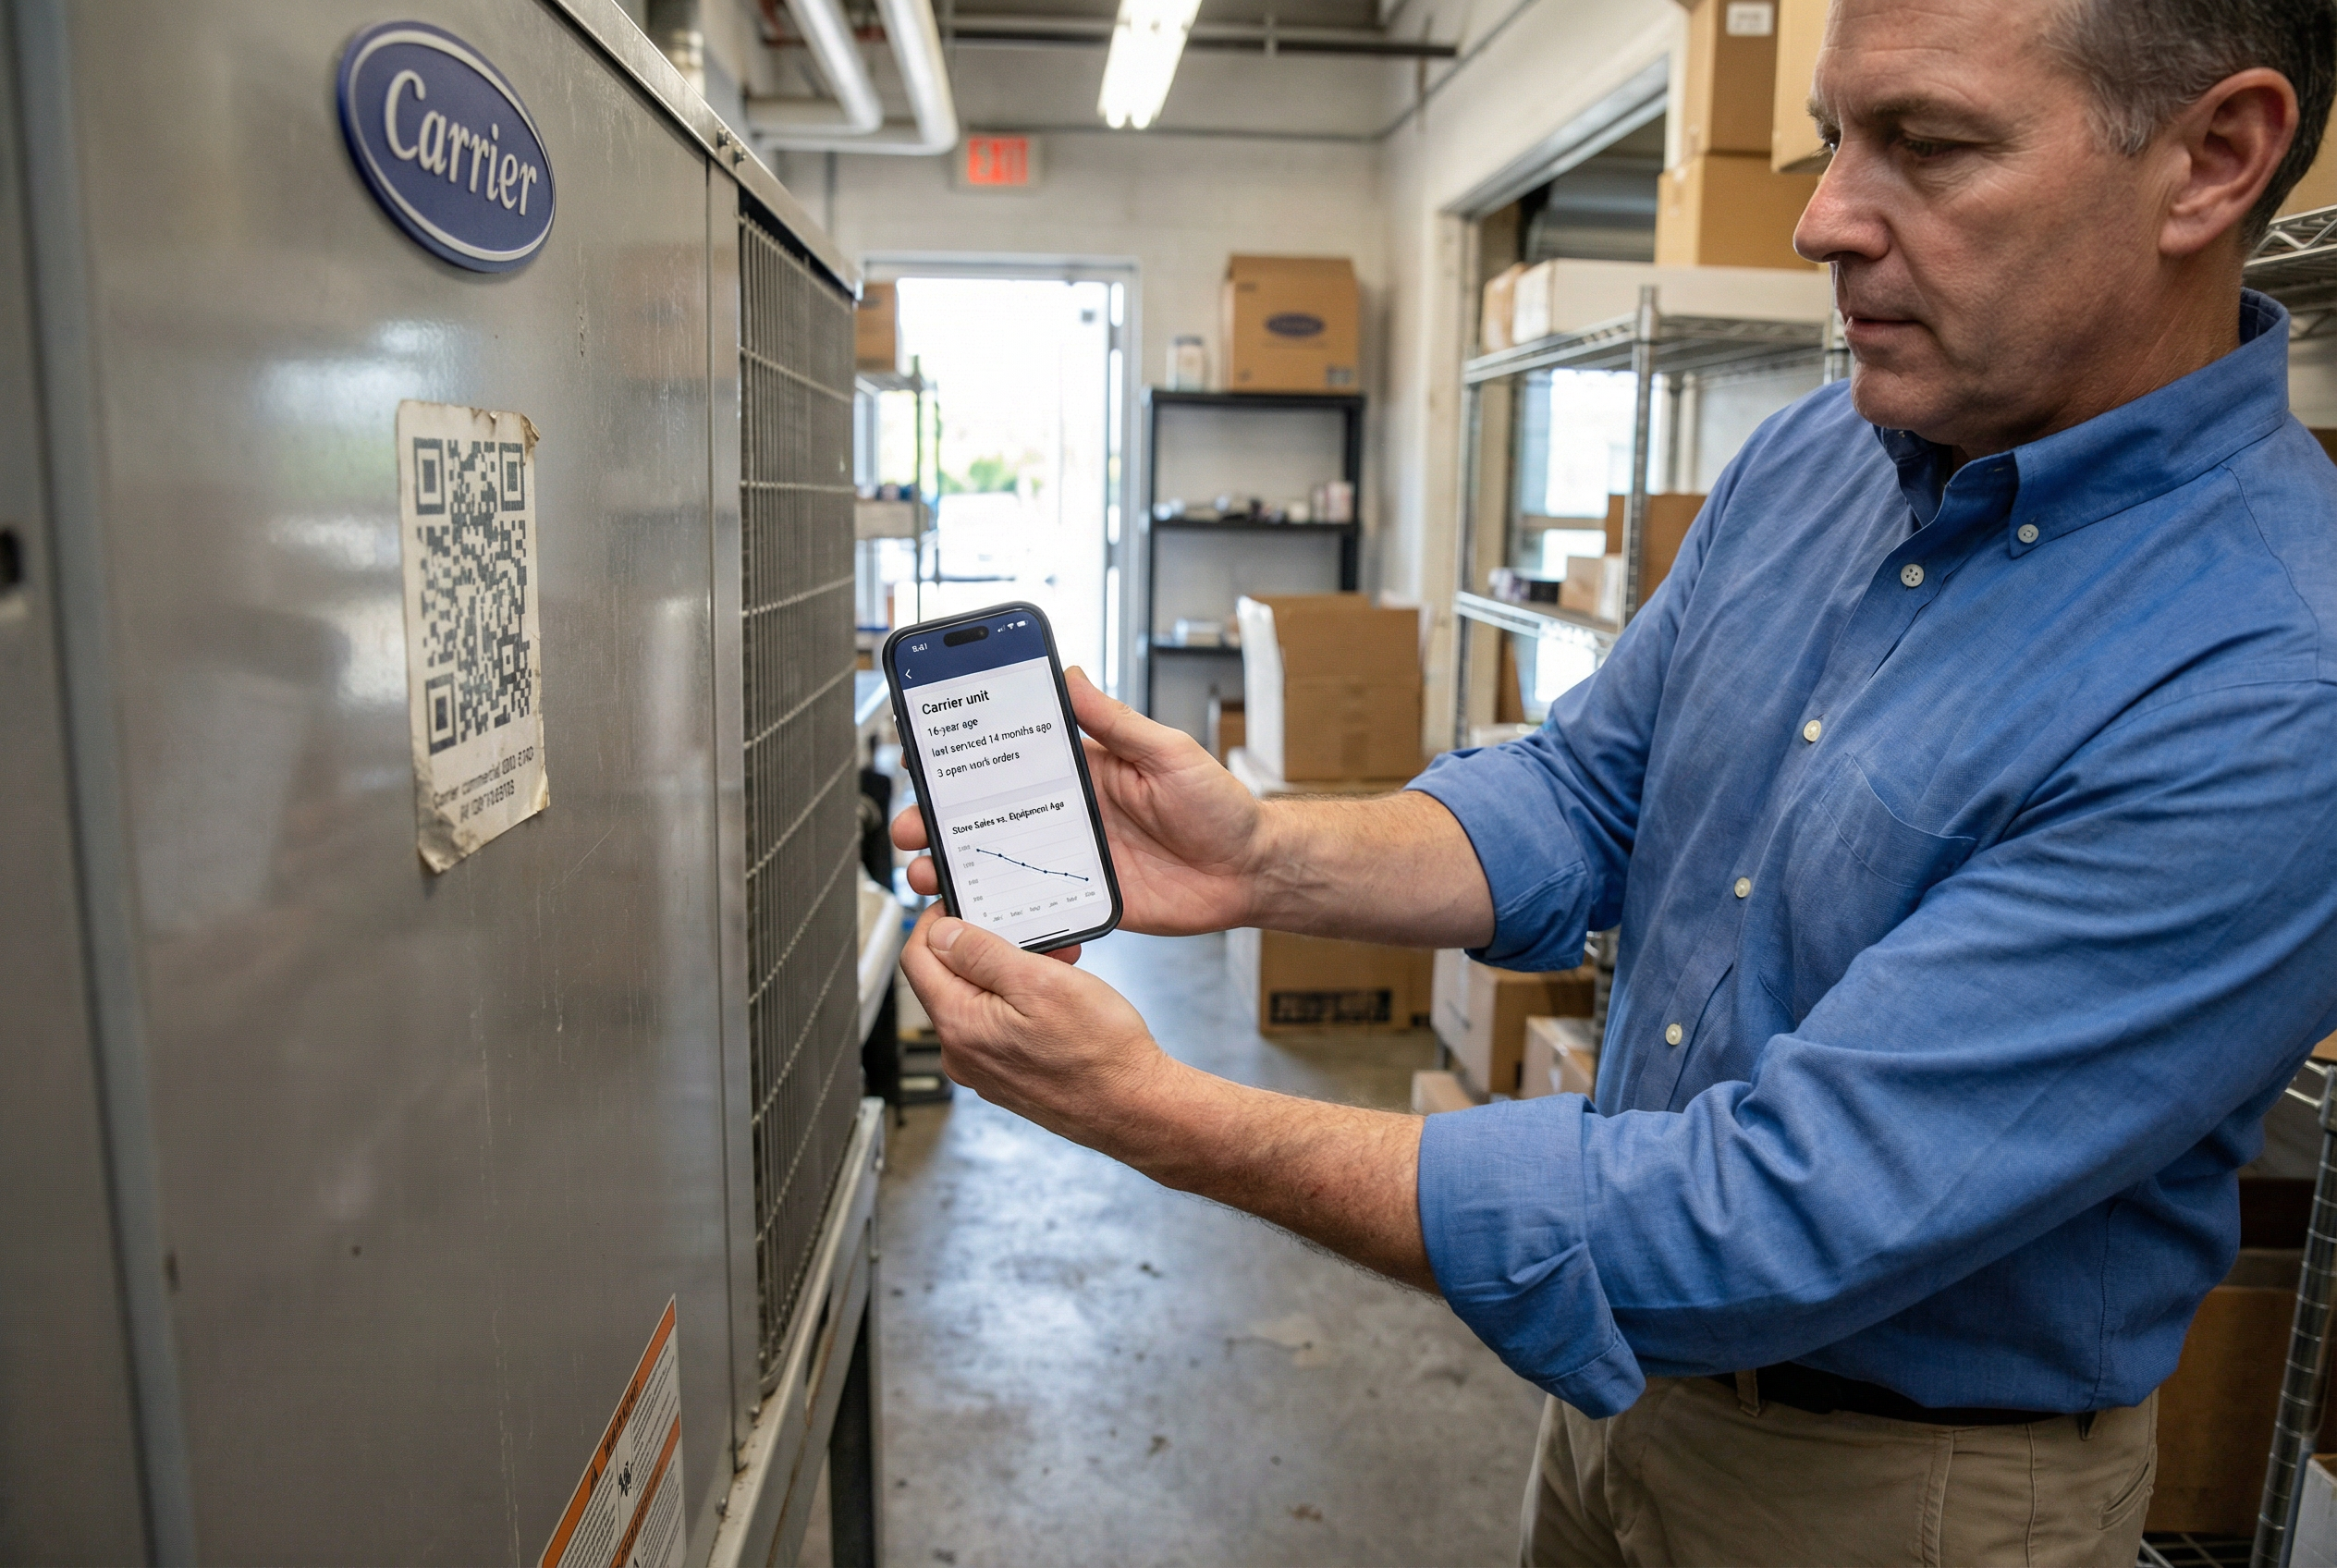
There's a specific moment every operations director knows: standing next to a piece of equipment during a store walk — HVAC unit, refrigeration case, prep line — and wondering whether what you're looking at is worth escalating. Is this equipment old? Has it been serviced recently? Is this store's performance lag related to what you're standing in front of, or is it something else?
Without Robotic Imaging's platform, that question either goes unanswered or requires a follow-up request to the facilities team, a wait for a response, and a decision made without field-level context. With the platform, the answer is a 5-second QR code scan on an iPhone.
Each piece of equipment carries a QR code label — applied at initial documentation, priced at $0.01-0.05 per label — that links directly to that equipment's complete profile in the platform. Scanning during a store walk surfaces: equipment age, manufacturer specifications (extracted at 85-90% AI accuracy), complete service history, warranty status, and the store's performance metrics alongside comparable locations.
For the operations director persona specifically, this field intelligence capability serves two distinct purposes. First, it's contextual intelligence during store visits — the ability to confirm or investigate equipment-performance hypotheses in real time rather than theoretically. Second, it's capital advocacy evidence gathered firsthand — "I walked Store #1147, scanned the refrigeration equipment, confirmed 16-year average age across 8 units, and pulled up the store's NPS trajectory against district peers" is a more persuasive capital planning input than a facilities report summary.
The QR code infrastructure also supports the 85-90% AI extraction accuracy advantage that makes the underlying portfolio data reliable. When store-level teams document new equipment via smartphone photo — taking 5-10 seconds per item — the AI processes manufacturer specs and populates equipment profiles automatically, keeping the portfolio intelligence operations directors rely on current without creating a documentation burden on field teams.
The Operations Director Platform Advantage: From Portfolio Blind Spots to Mobile Intelligence
The competitive landscape for multi-site operations management tools has a clear gap: every major platform in the space — ServiceChannel, Limble CMMS, UpKeep — addresses the maintenance workflow. None directly addresses the operations director's need to see equipment condition as one dimension of store performance, accessible on a mobile device, formatted for capital planning advocacy rather than work order routing.
Robotic Imaging's platform occupies that unaddressed position with verified enterprise-scale deployment proof. The same platform managing equipment portfolio intelligence across 7-Eleven's 1,000+ store network — and supporting Dollar General's planned 4,000-location rollout — delivers the mobile operations intelligence store operations directors need without requiring facilities team coordination for every insight.
The transformation for operations leadership is concrete: Monday morning portfolio review happens on a phone before the first meeting. Regional manager presentations use live tablet data instead of static slides. Store visits generate capital planning evidence through QR code scans. Equipment failure alerts arrive with operational consequence context before product loss or customer complaints confirm the problem. Capital planning advocacy carries integrated equipment-performance correlation data instead of assembled exports from disconnected systems.
For a 100-store portfolio, that operational intelligence integration delivers $600K+ net annual value with a payback period under two months — a return driven not by maintenance cost reduction, but by operational efficiency gains, capital planning precision, and avoided revenue impact from equipment-driven customer experience failures.
Operations directors managing Fortune 500 retail portfolios shouldn't be working from incomplete data because equipment intelligence lives in a system built for technicians.
Ready to see your portfolio with equipment-operations integration?
Request an Operations Director Platform Demo — see how your portfolio looks with equipment status integrated into your store performance view.
Schedule an Operations Leadership Briefing — a VP-appropriate 30-minute session focused on capital planning advocacy and portfolio intelligence strategy for enterprise retail operations.
Download the Operations Director Portfolio Intelligence Guide — detailed walkthrough of equipment-operations correlation analysis, benchmarking methodology, and mobile deployment for multi-location retail leadership.