Mobile Asset Intelligence Dashboard: Real-Time Portfolio
Robotic ImagingMarch 31, 2026
Mobile Asset Intelligence Dashboards and Reporting
For facility directors managing multi-location retail portfolios, asset intelligence has historically been office-bound. Reports live on desktop dashboards, capital planning data requires IT-generated exports, and field visits happen without real-time portfolio context. Robotic Imaging's mobile asset intelligence dashboard delivers responsive portfolio analytics — equipment inventory, age distribution, geographic visualization, and capital forecasting — accessible from smartphones, tablets, and desktops with automatic device optimization and real-time updates as distributed teams document equipment across stores.
This sub-pillar covers the dashboard and reporting layer of Robotic Imaging's mobile-first platform. For documentation workflows that populate dashboard data, see the Complete Guide to Mobile Asset Documentation & Intelligence.
What Is a Mobile Asset Intelligence Dashboard?
A mobile asset intelligence dashboard is not a desktop analytics interface resized for a smaller screen. The distinction matters because most CMMS platforms — including enterprise tools like IBM Maximo and mobile-first maintenance apps like UpKeep — deliver dashboards designed around desktop workflows, then adapted for mobile as a secondary consideration. The result is pinch-to-zoom navigation, horizontal scrolling on touch displays, and load times that make field use impractical.
Robotic Imaging's platform is architecturally different. Native iOS and Android apps — not mobile web — deliver the portfolio analytics layer with sub-2-second load times and 60fps scrolling. Dashboard data reflects real-time documentation activity from distributed teams across hundreds of store locations, not scheduled report batches emailed on a weekly cycle.
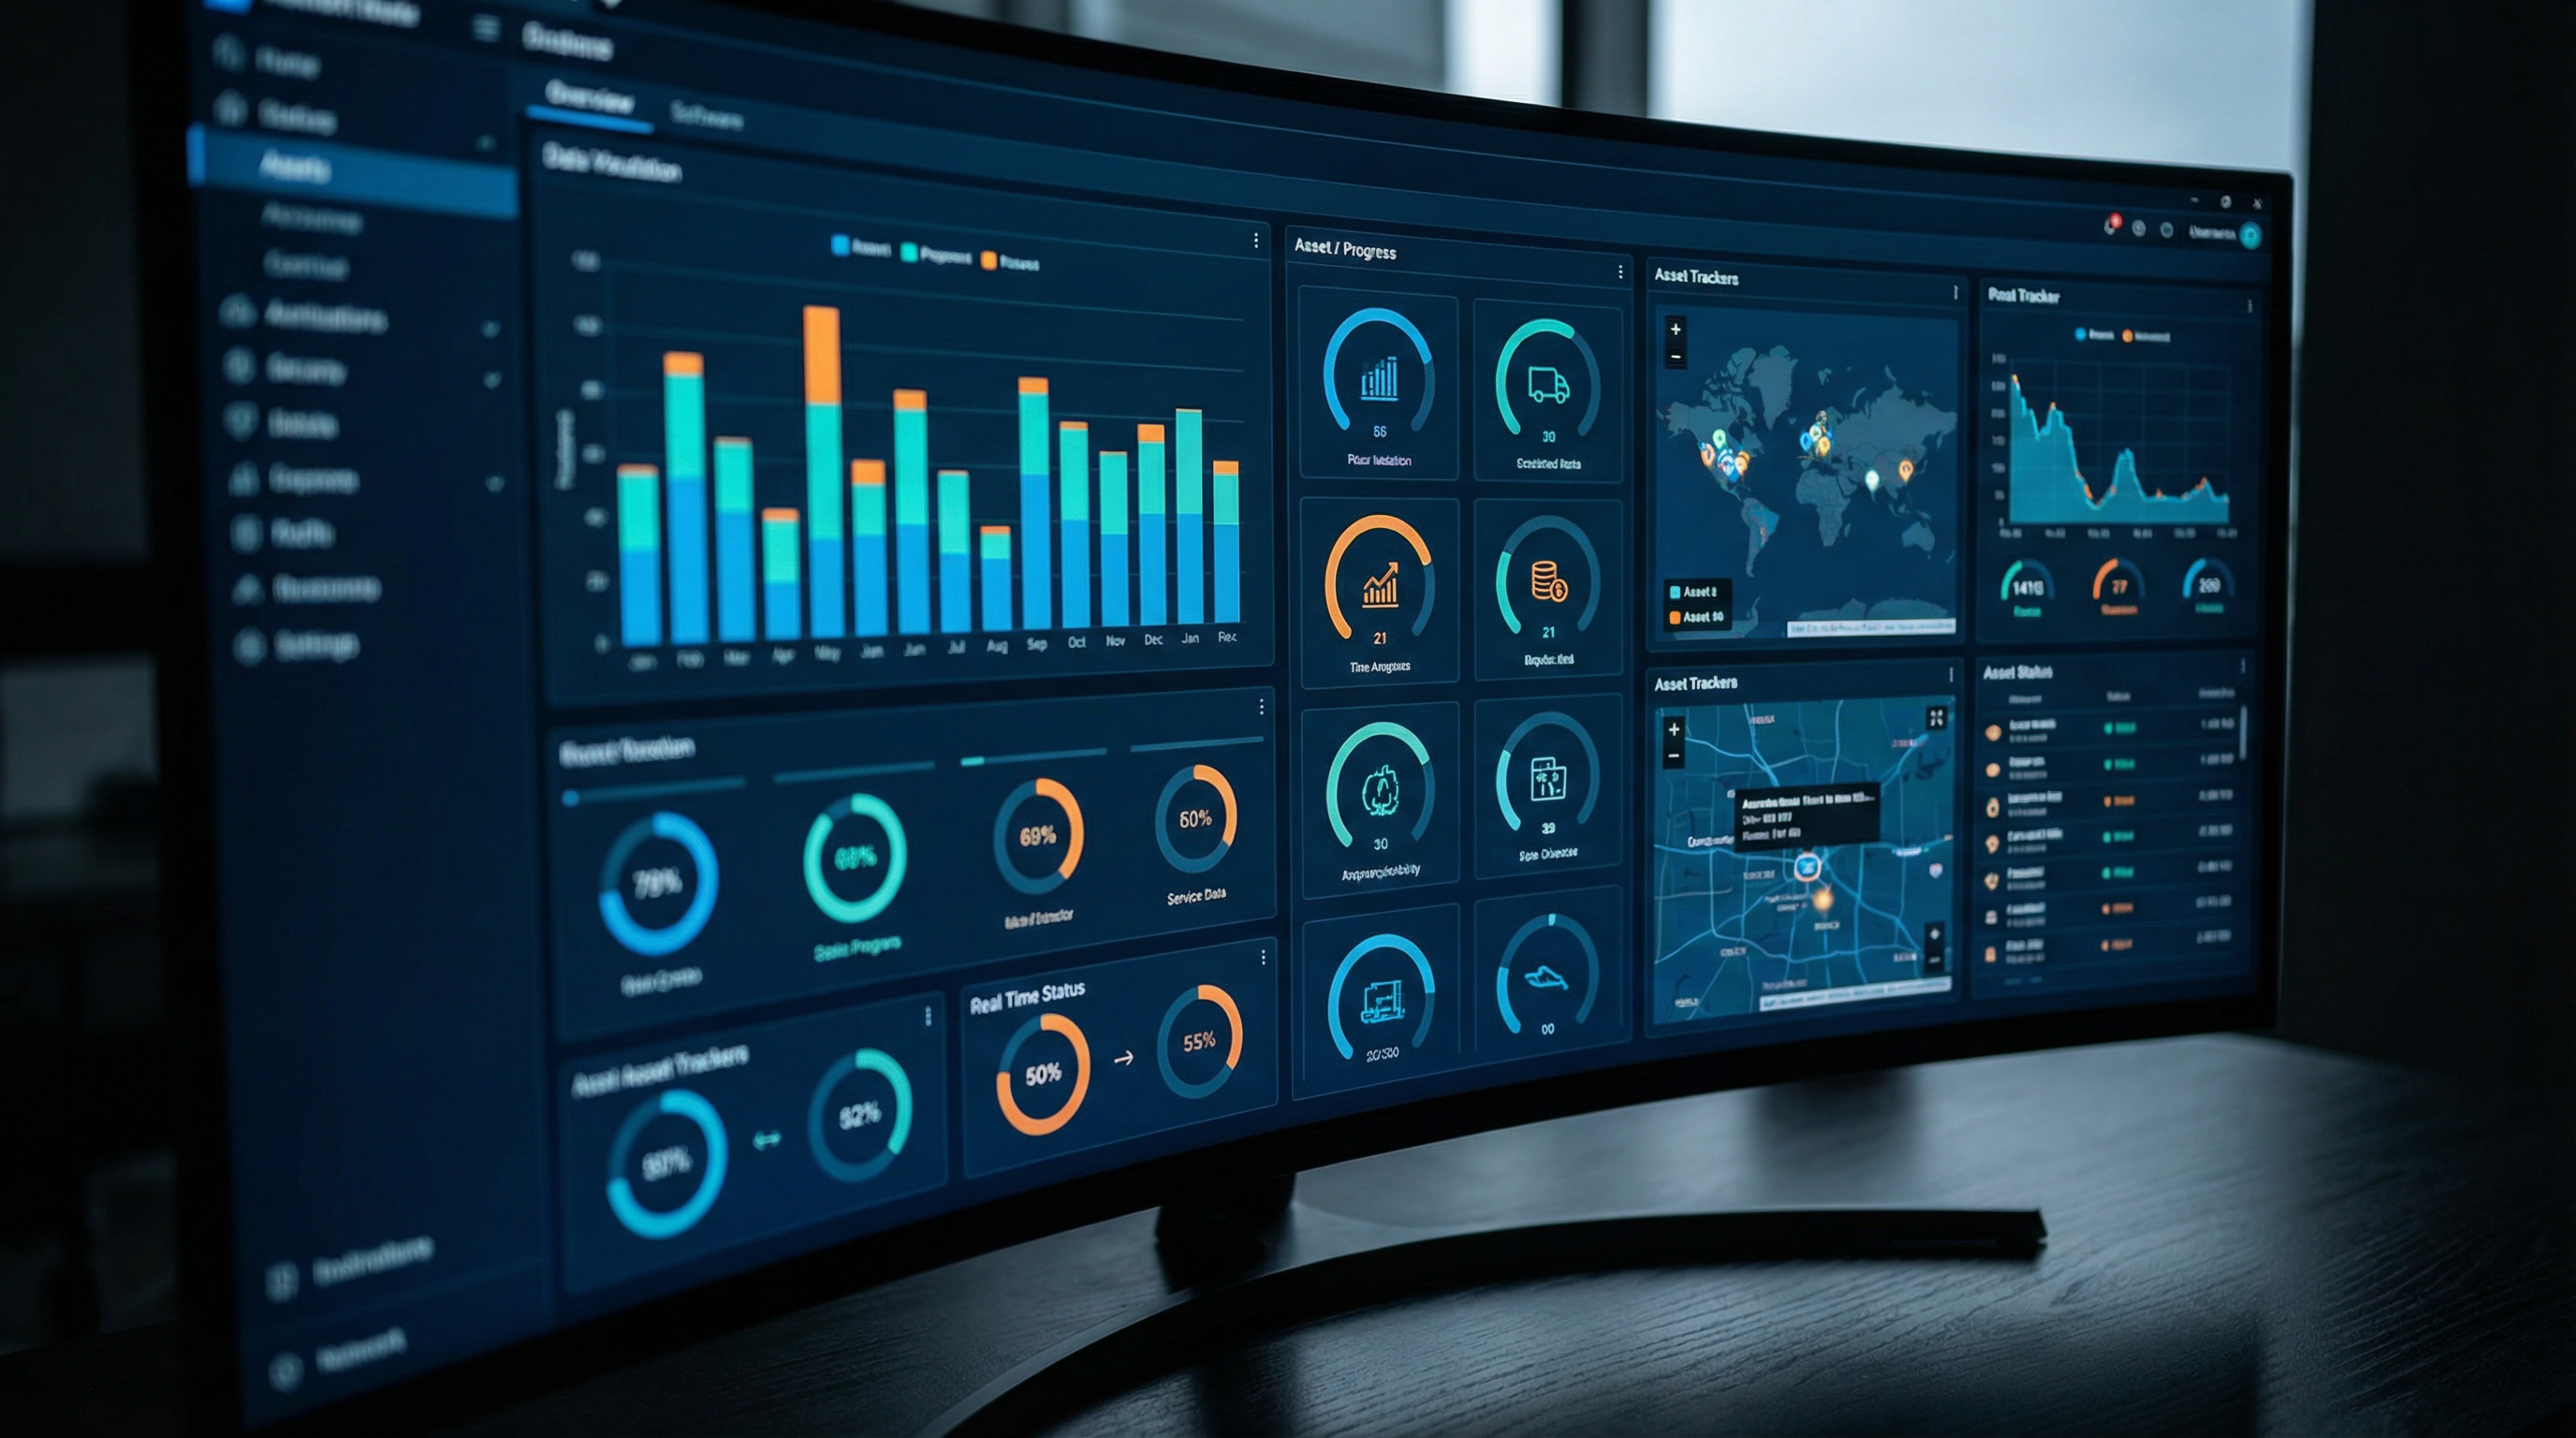
> Mobile asset intelligence dashboards provide responsive design automatically optimizing for smartphones, tablets, and desktops — displaying real-time portfolio analytics including equipment inventory, age distribution by location, geographic visualization with color-coded store status, and capital lifecycle forecasting. Hierarchical drill-down navigation moves from corporate portfolio to individual equipment detail using touch-optimized interfaces, with mobile PDF report generation enabling facilities directors and CFOs to access and share portfolio intelligence from any device anywhere.
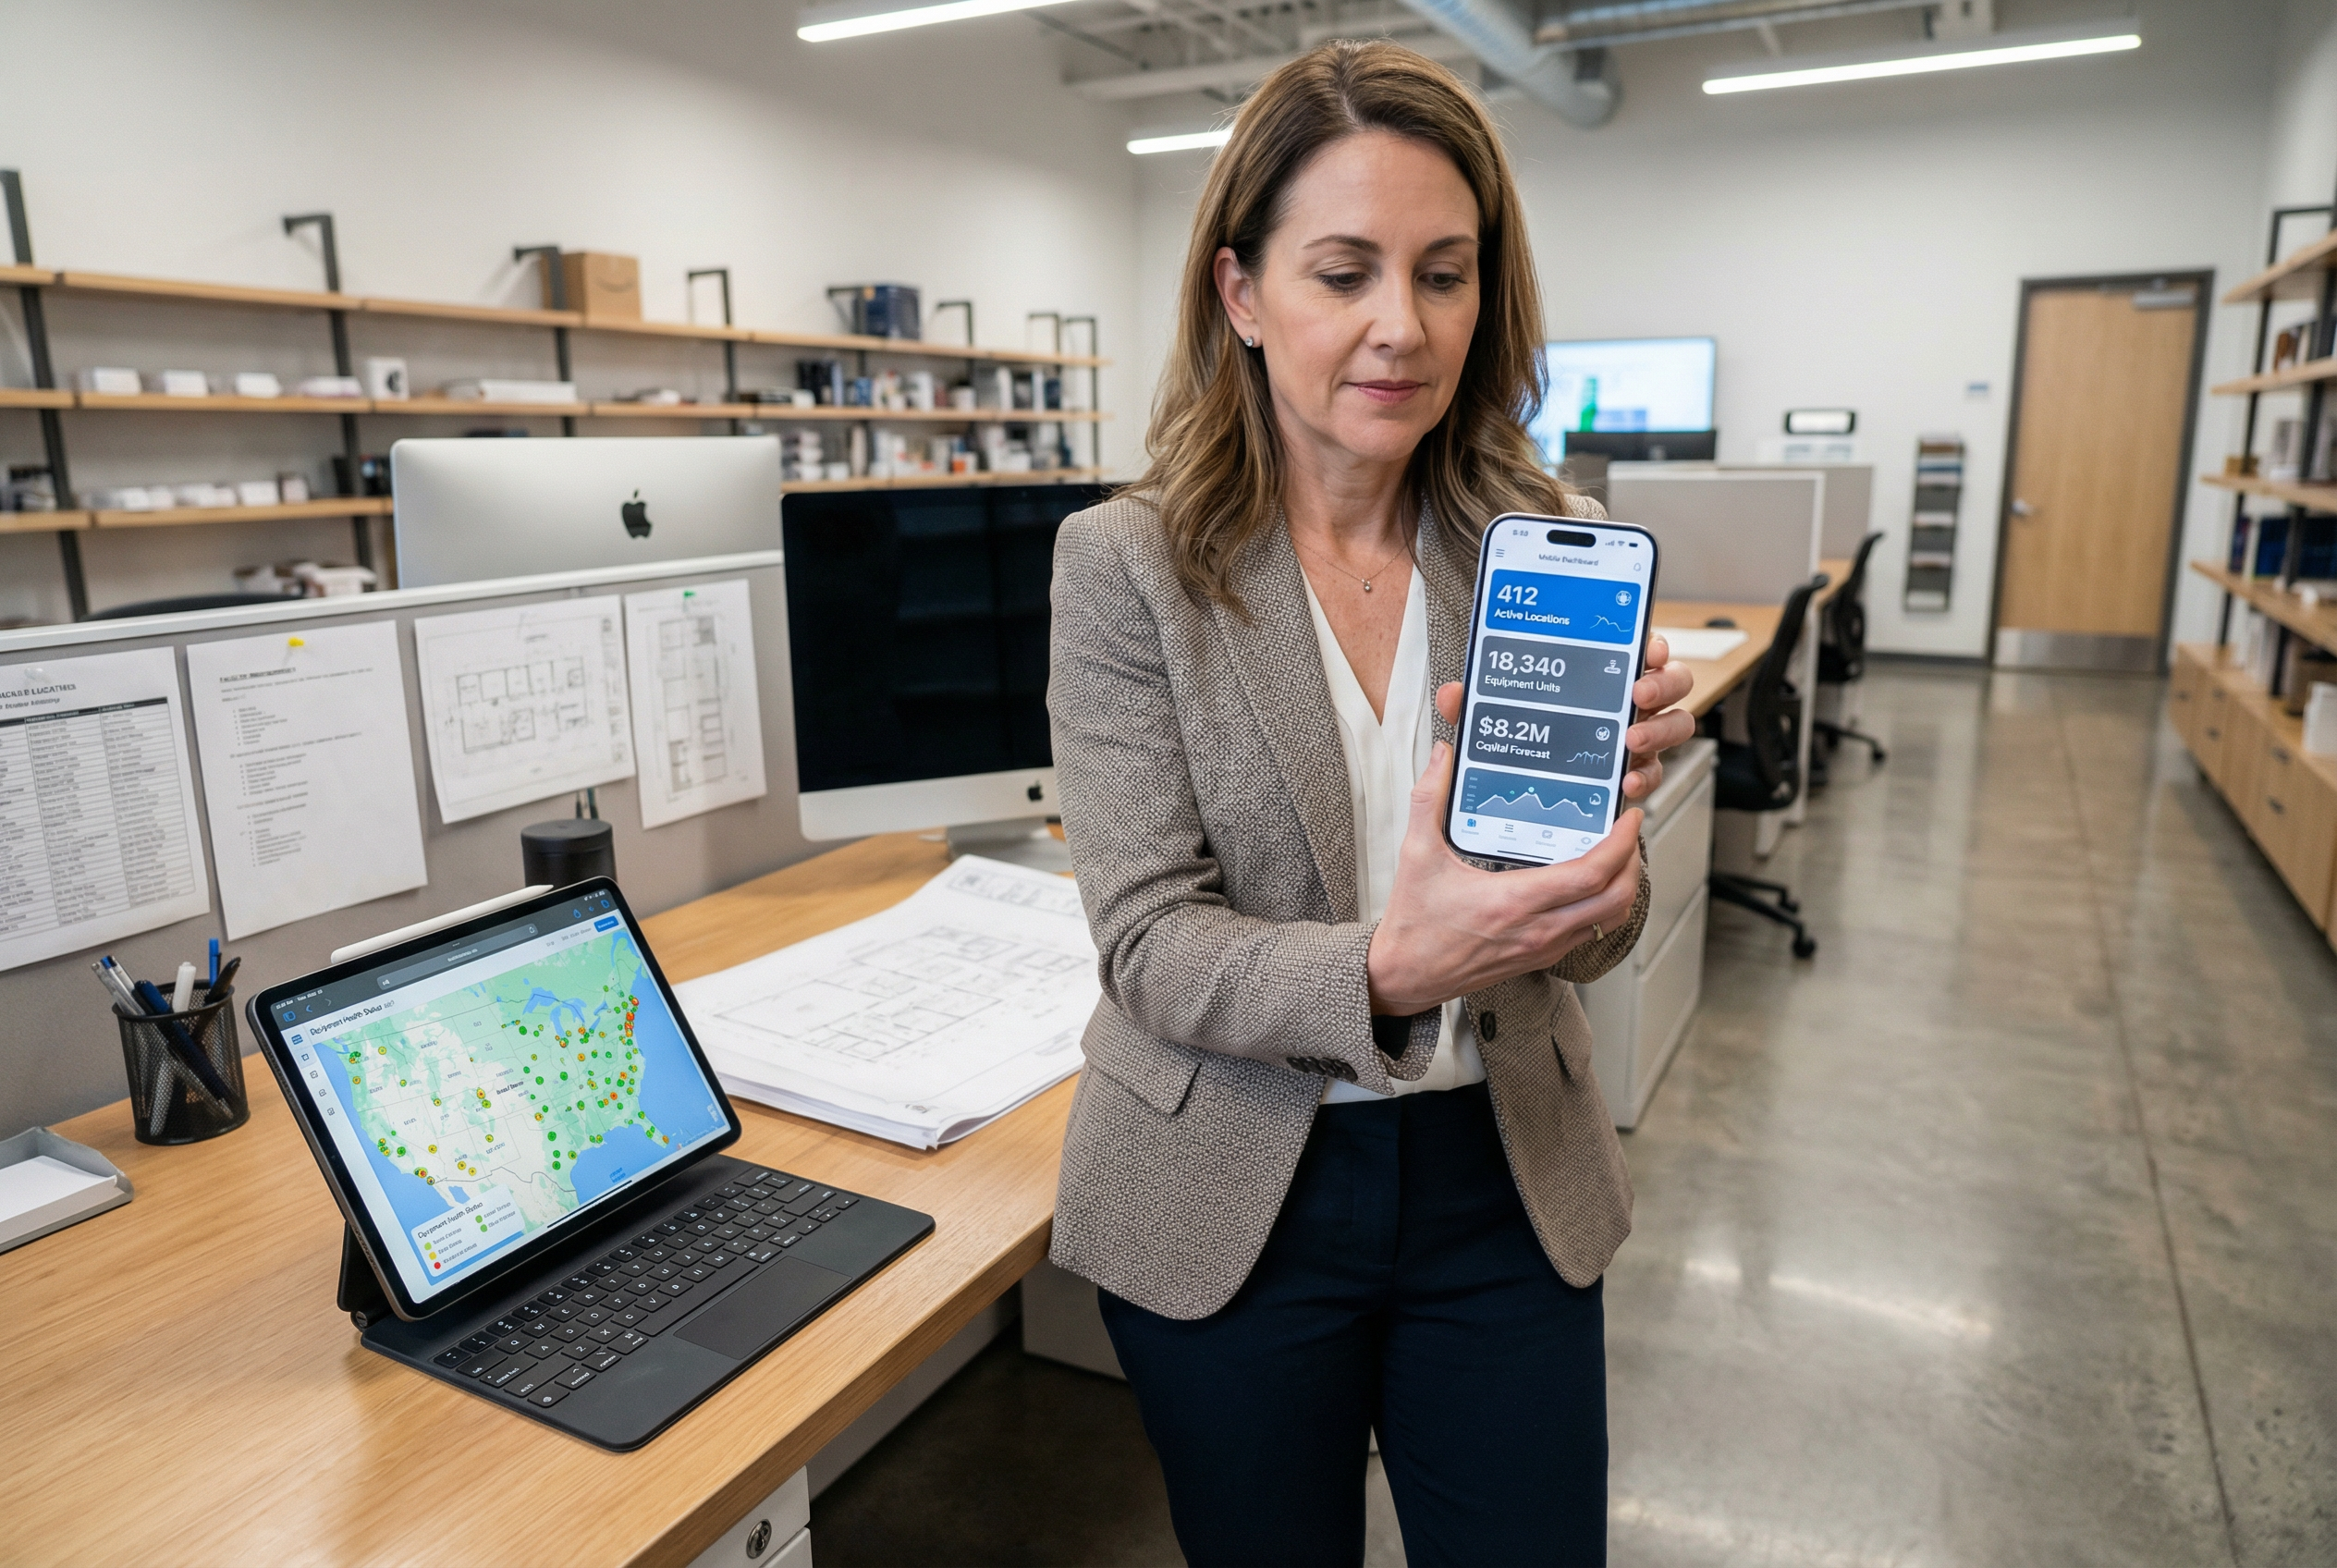
The practical difference: a facilities director can pull up accurate, current equipment data for a specific store while standing in that store's equipment room — without returning to the office, without requesting a report from IT, and without WiFi if the building's signal is poor.
See the mobile asset intelligence dashboard in your portfolio context. Request a focused demo.
Responsive Dashboard Design and Device Optimization
The same portfolio data renders correctly whether accessed from a 6-inch smartphone screen, a 12-inch tablet, or a 27-inch desktop monitor. This automatic device optimization is built into the native app architecture rather than bolted on through responsive CSS — which means chart libraries, touch gesture controls, and data density adjust to match the device rather than forcing the user to adapt to the interface.
Smartphone layout: Single-column priority display surfaces the highest-signal KPIs — portfolio health score, active alerts, equipment requiring immediate attention — before secondary analytics. Charts use vertical histogram layouts optimized for portrait orientation. Touch targets meet accessibility guidelines, preventing the frustrating mis-tap problem common on desktop-ported mobile interfaces.
Tablet layout: Two-panel architecture enables simultaneous list and detail views — a store list on the left, selected store equipment inventory on the right — replicating the side-by-side workflow that makes desktop interfaces productive while keeping touch navigation intuitive. Geographic map visualization renders at full resolution on tablet displays, showing color-coded portfolio status across regions without horizontal scrolling.
Desktop layout: Full analytical depth with multi-panel dashboards, comparison views across multiple locations or equipment categories, and direct export controls. The asset tracking dashboard experience on desktop retains the same data layer accessed on mobile — ensuring the field visit view and the boardroom view reference identical, simultaneously updated information.
Offline functionality extends device optimization to connectivity-constrained environments. Up to 1,000+ equipment records cache locally on the device, enabling full dashboard navigation during store visits in basement equipment rooms, rural locations, or areas with weak carrier signal. Automatic background sync updates the cache when connectivity resumes — no manual refresh required.
Real-Time Portfolio Analytics
The intelligence value of a portfolio asset reporting layer depends entirely on data completeness and currency. Static scheduled reports reflect inventory as it existed at the last export cycle — potentially days or weeks behind actual documentation activity. Robotic Imaging's real-time asset dashboards update continuously as distributed field teams document equipment across store locations, meaning the portfolio analytics layer reflects current ground truth rather than historical snapshots.
Equipment inventory counts display across the full portfolio hierarchy. A 500-location retail portfolio might surface 15,000 refrigeration assets, 3,200 HVAC units, 8,700 lighting fixtures, and 2,100 electrical panels — each category queryable by location, age cohort, manufacturer, or condition status. Equipment counts update in real time as new documentation arrives from field teams, ensuring the inventory figure a facilities director references during a capital planning conversation matches what documentation teams captured yesterday.
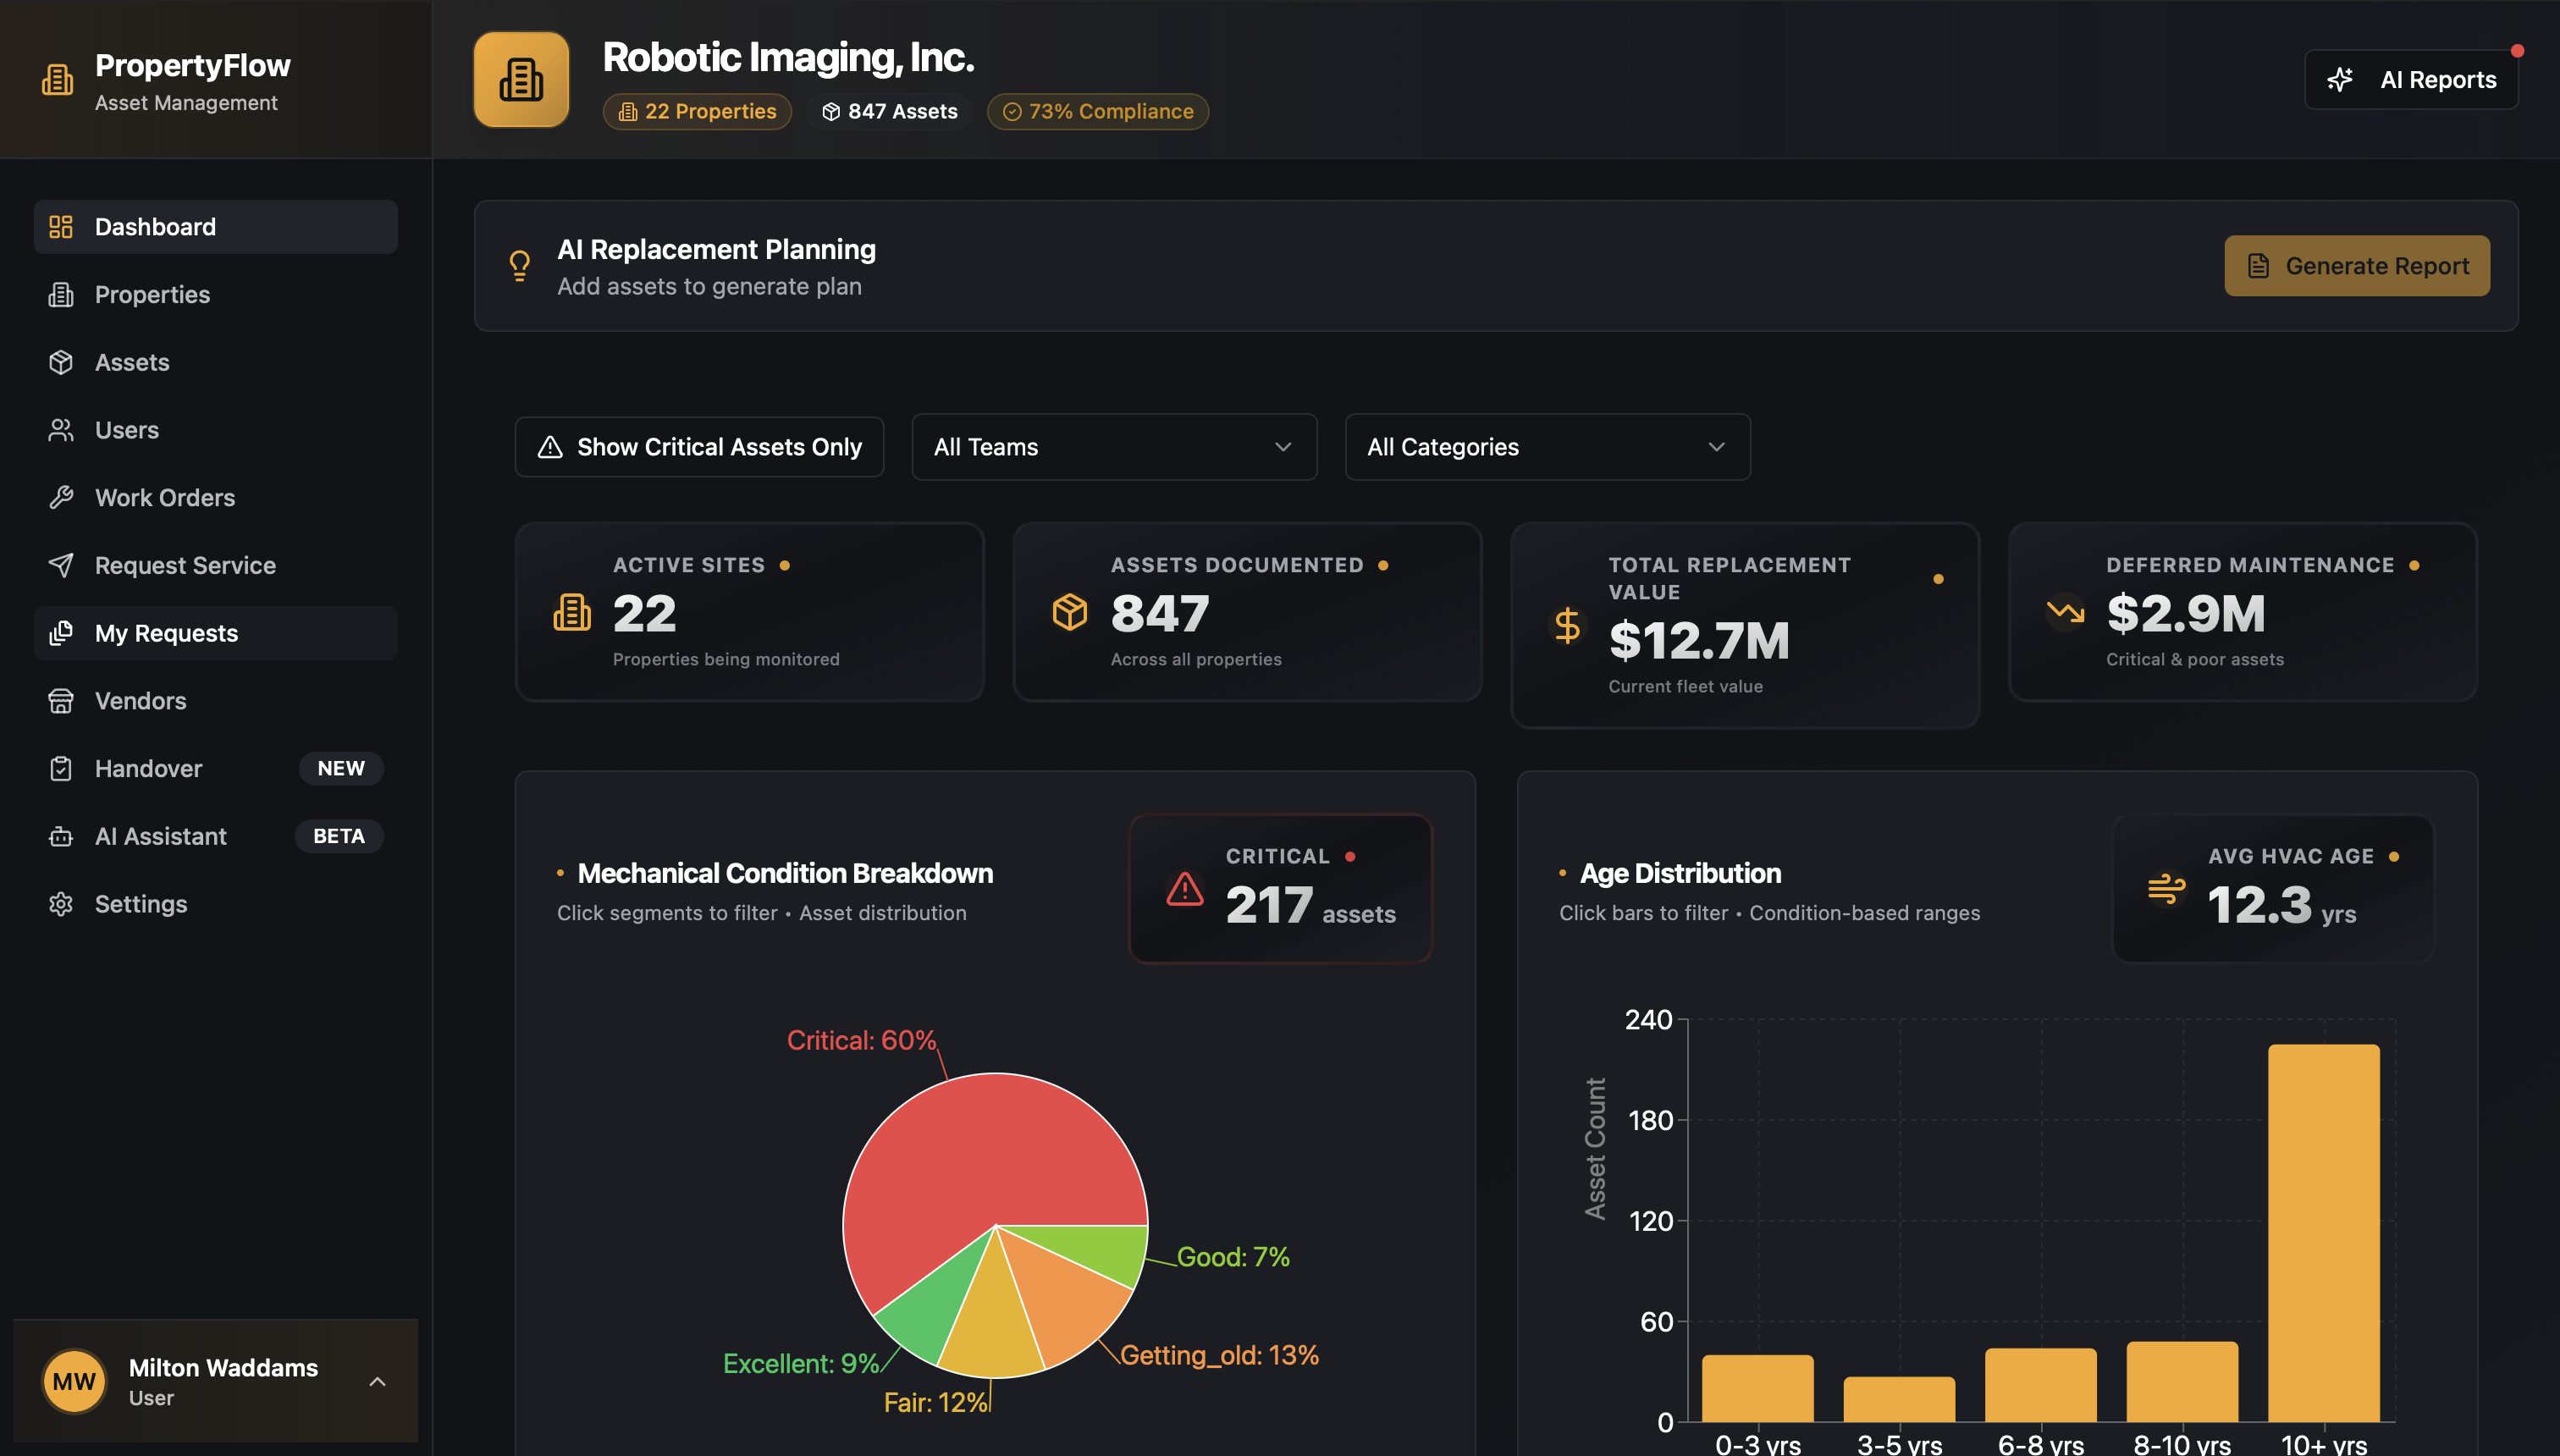
Age distribution analytics visualize equipment aging across the portfolio through histogram displays showing what percentage of each equipment category falls into each age cohort. An example distribution might show 28% of refrigeration units under 5 years, 41% between 5-10 years, 22% between 10-15 years, and 9% beyond manufacturer recommended service life. This age distribution view translates directly to capital planning horizon visibility — identifying the replacement volume approaching in each 12-month, 24-month, and 36-month window.
Geographic visualization maps portfolio health using color-coded store status — green indicating stores with current equipment documentation and no aging alerts, yellow flagging locations with equipment approaching end-of-life thresholds or incomplete documentation, red identifying stores with equipment beyond service life requiring prioritized capital attention. Regional patterns emerge visually: a concentration of red and yellow status in a specific geographic cluster often reflects equipment installed during a regional rollout cohort approaching simultaneous end-of-life.
Condition status tracking integrates AI-extracted equipment specifications — captured at 85-90% automated accuracy from smartphone photos during field documentation — with manufacturer service life data to generate current condition assessments. This facility asset analytics layer replaces manual condition audit programs that cost $5,000-$15,000 per location with continuous, self-service intelligence updated through normal field documentation workflows.
7-Eleven's deployment across 1,000+ stores demonstrates this real-time intelligence model at scale: distributed documentation teams across a large retail network simultaneously feeding portfolio analytics that regional managers and corporate facilities teams access from their preferred device.
Hierarchical Drill-Down Navigation on Mobile
The full value of a portfolio-scale dashboard depends on navigating from aggregate portfolio view to individual equipment detail without losing context or rebuilding the query path. Robotic Imaging's mobile equipment intelligence architecture enables a complete drill-down sequence optimized for touch navigation:
Corporate → Regional → District → Store → Equipment
Each level presents the appropriate data density for that scope. The corporate view shows portfolio-wide KPIs — total equipment counts, overall age distribution, geographic health visualization, aggregate capital forecast. Tapping a region narrows to regional-level analytics, preserving the same KPI framework but filtered to regional scope. District-level drill-down surfaces store-by-store comparison within the district. Store-level view shows complete equipment inventory for that location with individual asset condition status. Equipment-level detail shows full asset record: manufacturer, model number, serial number, installation date, age, condition status, maintenance history, and documentation photos.
Breadcrumb navigation at the top of each screen — Corporate > Southeast Region > District 14 > Store #2847 > HVAC Units — maintains positional awareness throughout the drill-down sequence, enabling immediate navigation back to any parent level without retracing the full path.
Touch-optimized controls make this navigation functional on smartphones during active store visits. A facilities director walking through a store can pull up the store's equipment list, identify a specific RTU unit, tap through to its full asset record, and verify the installation date and warranty status in under 30 seconds — using one hand if needed. This is the mobile asset analytics capability that desktop-ported interfaces cannot replicate: genuine touch-first navigation purpose-built for field use rather than adapted from desktop interaction patterns.
Executive Dashboard Views and KPIs
CFOs and COOs accessing portfolio intelligence need a different data view than the operational detail that serves facilities directors. Robotic Imaging's executive dashboard presents high-level KPIs optimized for the capital planning and board presentation context — accessible from tablets and smartphones without requiring navigation through operational-level detail.
The executive portfolio view surfaces four primary KPI categories:
- Portfolio Health Score: A composite index aggregating equipment age distribution, condition status, and documentation completeness into a single portfolio-level metric, with regional breakdown enabling geographic comparison
- Capital Forecast: Projected replacement capital required across 12-month, 24-month, and 36-month horizons, derived from AI-extracted age data and manufacturer service life parameters — providing the forward-looking capital visibility that static audit programs update once every 2-3 years
- Equipment Aging Summary: Percentage of portfolio by equipment category approaching end-of-life thresholds, formatted for board presentation without requiring operational-level data literacy
- Geographic Priority Map: Color-coded regional visualization identifying highest-capital-priority locations, enabling resource allocation decisions without requiring drill-down navigation
For a 100-store retail portfolio, this executive mobile asset analytics view connects to $600K+ net annual value through improved capital forecasting precision, eliminated audit fees, and avoided emergency replacement costs from unplanned equipment failures.
A CFO accessing the portfolio health score and 36-month capital forecast from a tablet during a board meeting has the same data available as the facilities team using desktop dashboards in the operations center — because the native app architecture and real-time sync ensure device format does not determine data access.
Mobile Report Generation and Export
Field-based intelligence becomes actionable when it can be shared from the field without requiring a return to desktop. Robotic Imaging's platform enables mobile report generation across multiple formats directly from iOS and Android devices:
PDF report generation from any dashboard view — portfolio-wide, regional, store-specific, or equipment category — creates professionally formatted reports with the current data state captured at generation time. A facilities director completing a store visit can generate a store-specific equipment report, add field notes, and email it to the regional manager before leaving the parking lot. The report format matches what would be generated from desktop, maintaining professional presentation quality regardless of generation device.
Export formats extend beyond PDF to CSV and Excel for downstream capital planning analysis. Equipment inventory exports filtered by age cohort, location, or equipment category integrate directly into capital budgeting spreadsheets and financial planning tools without requiring data reformatting.
Scheduled report distribution automates recurring asset management reporting to stakeholder distribution lists — weekly portfolio health summaries to regional managers, monthly capital forecast updates to CFO, quarterly documentation completeness reports to facilities directors — without requiring manual generation or desktop access.
Dollar General's planned deployment across 4,000 locations represents the scale at which automated mobile report generation becomes operationally essential: regional managers receiving location-specific intelligence reports without requiring centralized staff to generate and distribute each report manually.
Mobile Dashboard Access That Scales With Your Portfolio
Multi-location retail portfolio management has historically required teams to return to the office for asset intelligence. Static reports, desktop-bound dashboards, and connectivity-dependent CMMS tools create a gap between field reality and portfolio data — a gap that widens as portfolios grow from 50 locations to 500.
Robotic Imaging's mobile asset intelligence dashboard closes that gap through native iOS and Android architecture delivering real-time portfolio analytics, hierarchical drill-down navigation, executive KPI views, and mobile report generation — all accessible without WiFi when field conditions require it. The same platform supporting 7-Eleven across 1,000+ sites delivers the same mobile intelligence capability for portfolios at 50, 200, or 500 locations.
For facilities directors making capital decisions in the field and CFOs accessing equipment aging data during board meetings, mobile portfolio intelligence is not a convenience feature — it is the difference between data-informed decisions and best-estimate decisions.
See the full mobile asset intelligence dashboard with your portfolio structure. Schedule a focused demo or request an executive briefing to explore capital planning KPI access for your CFO and operations leadership.